By Bridget Suda, Cityworks Regional Sales Manger
An ArcGIS dashboard is a great tool for helping organizations visualize and share data. ArcGIS dashboards transform operations and asset data into actionable information and are easy to share both internally and with external stakeholders. In just three steps, you can create an enterprise URL (eURL) to display Cityworks data in an ArcGIS dashboard. For this example, we’ll configure a dashboard to display public works service requests and work orders data.
Step 1: Create the query
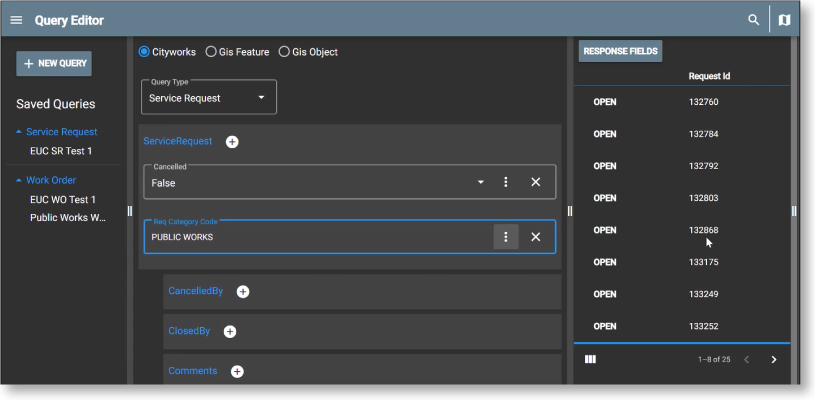
After signing into Cityworks using Single Sign-on for ArcGIS Portal, the first step is creating the query so that eURL will know which data to make available. Then, click the search button to access the Query Editor to view existing saved queries and to create a new one. After giving the query a name, select the query type from the dropdown list—in this case, it’s going to be service requests. The service requests fields pop up, paving the way to build the query. Use the simple point and click interface to populate the query with the desired fields. In this example, we’ll use the status code “not canceled” and the request category “public works.”
Once the field has been established, options filter into the dropdown area with results populating in the right panel, confirming it is returning the desired results. That query can now be saved.
Step 2: Create a new eURL
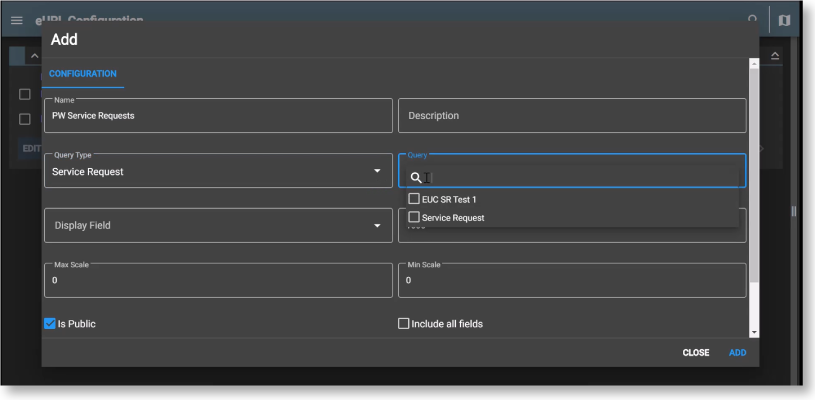
The second step is to create the new eURL with the saved service request query. It’s important to decide which fields to expose through the eURL since the selected fields will be publicly available on the web map’s configured pop-ups. For example, you might not want to publish the name of the employee who received the work activity. The search functionality is designed to make it easy to locate fields of interest rather than scrolling through an entire list.
Once the configuration box is completed and fields of interest are identified, click “add,” which will populate a new public works service request eURL ready to be incorporated into the ArcGIS dashboard.
Step 3: Copy and paste the newly created eURL into a web map
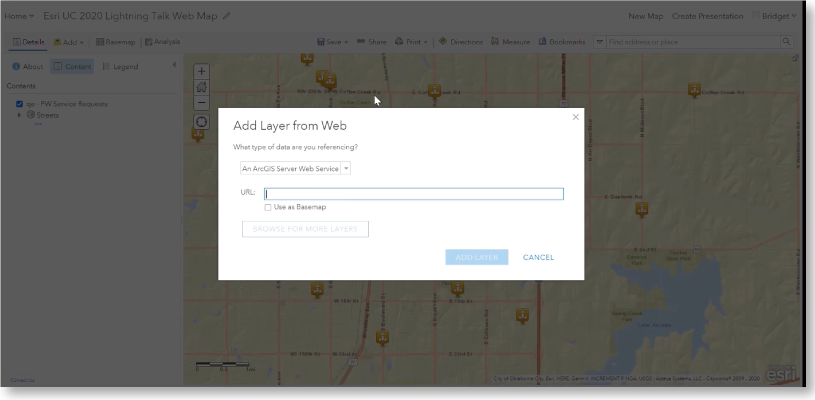
The third step in Cityworks is clicking the URL link on the newly created eURL. Essentially, eURL creates a feature service. The eURL can be copied and pasted into a web map.
Diving into the Esri side of the process, a web map is created with the base map of choice. Layers can be added from the web using the URLs. Web map pop-ups can be configured, and layer names can be edited. Attributes selected as part of the eURL creation are displayed in the desired order. Don’t forget to save the web map!
Building the dashboard
Next, it’s time to build the dashboard using different widgets. The dashboard can be configured to look and act as desired. It can be constructed by first adding the map that was created and giving users a few simple options. Charts and graphs can be added to provide greater data visualization.
A pie chart, for example, can be built using service requests. The pie chart can be built off of the “status description” category to offer a breakdown of the status of service requests. With a few clicks, the pie chart is constructed and ready for a title, which can be centered, large, and bold for easy viewing.
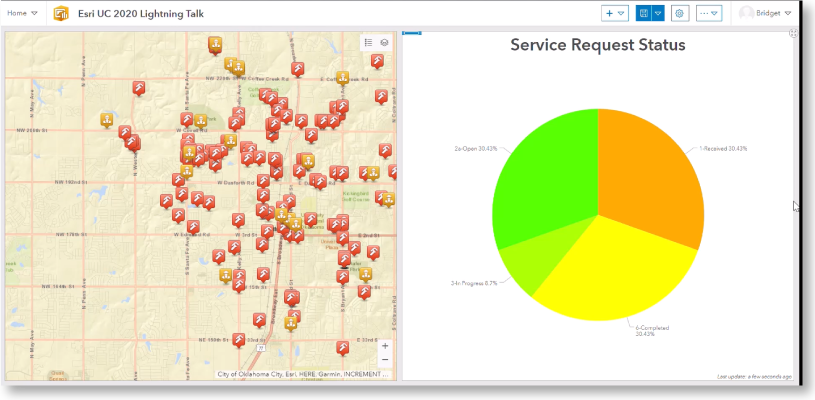
What really makes these dashboards engaging is the ability to add actions that make the dashboard interactive. Users can configure it so the maps and charts will update their displayed data when a particular slice or bar of a chart is selected. Clicking on parts of the charts will affect what’s displayed on the map that’s on the dashboard as well as other charts that will eventually be added.
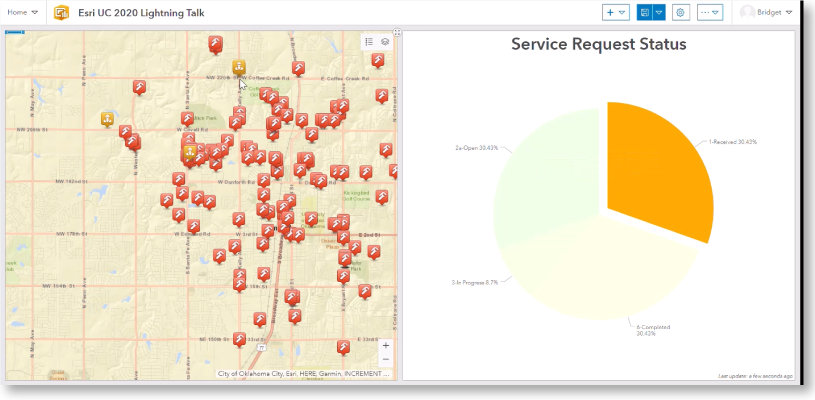
For example, clicking on the “received” status on the pie chart hides a number of service requests from the map because they don’t have a status of “received.”
Additional components can be added and edited, enabling users to see the breakdown of how many requests there are for the problem types being tracked and a breakdown of work orders per department. More actions can be configured for the Work Order chart so that when a bar on the chart is clicked, the pins on the map and total work orders adjust accordingly.
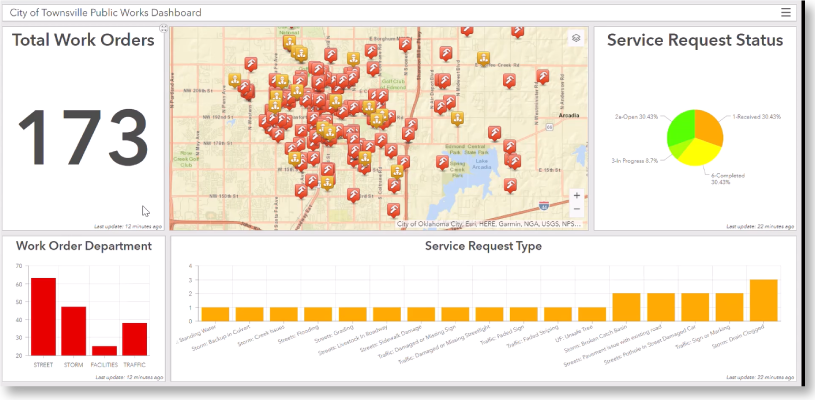
After adding the desired number of widgets, the project is finished. In this case, users can view total work orders, work orders by department, service request types, and service request status. The finished product now achieves the goal of helping users visualize data and transform it into actionable information.


